Understanding the Prometheus Pushgateway: When to Push, When to Pull, and What to Watch Out For
In the world of Prometheus, the “pull model“ is king. Your Prometheus server proactively scrapes metrics endpoints from your applications and infrastructure, giving you real-time insights and a clear understanding of what’s up. It’s elegant, efficient, and usually, it’s all you need.
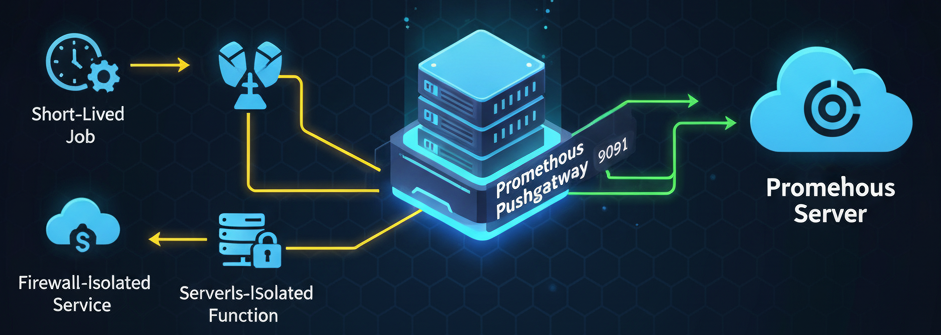
But what about those edge cases? The fleeting processes, the network-isolated services, or the batch jobs that run and vanish before Prometheus even has a chance to say hello? This is where the Prometheus Pushgateway steps in.
What is the Prometheus Pushgateway?
The Pushgateway is an optional component in the Prometheus ecosystem that acts as an intermediary metrics cache. Instead of Prometheus pulling metrics from your targets, your targets push their metrics to the Pushgateway. Prometheus then, in turn, scrapes the Pushgateway’s own metrics endpoint.
The Pushgateway Port
The Pushgateway lives on port 9091 by default.
- Your jobs push to an endpoint like:
http://<pushgateway-host>:9091/metrics/job/\<job_name> - Your Prometheus server scrapes its metrics endpoint:
http://<pushgateway-host>:9091/metrics
The Primary Use Cases: When Pushing Makes Sense
The Pushgateway isn’t meant to replace the pull model, but rather to complement it for specific scenarios where pulling is simply not feasible:
| Use Case | Description | Why the Pull Model Fails |
|---|---|---|
| Short-Lived Batch Jobs | Scripts, cron jobs, or tasks that start, run for a few seconds, and then exit. This is the canonical use case—capturing metrics before the process terminates. | The job is gone by the time Prometheus’s next scheduled scrape interval occurs (e.g., every 15 seconds). |
| Ephemeral Workloads | Serverless functions (like AWS Lambda) or other highly transient microservices that lack a stable network endpoint or lifespan. | Service discovery struggles to keep up with components that are born and die in rapid succession. |
| Network Constraints | Services or machines that are behind a restrictive firewall or NAT, preventing the Prometheus server from initiating an inbound connection (pulling). | Allowing an outbound push connection to the Pushgateway is often the only viable way to report metrics from isolated environments. |
Critical Concerns: What to Watch Out For (The Anti-Patterns)
While useful, the Pushgateway introduces complexities and can lead to significant blind spots if used incorrectly.
1. Stale Metrics and Data Lifecycle (The Biggest Risk)
- The Problem: The Pushgateway is a metrics cache that never forgets a time series once it’s been pushed. If a batch job fails and stops running, its last successful metrics remain in the Pushgateway forever. Prometheus continues scraping them, creating a false sense of security that the job is still running successfully.
- Mitigation: You must manually delete metrics from the Pushgateway via its API (using a DELETE request) after the job completes and you no longer need the data. Automate this cleanup within the batch job’s post-execution script.
2. Loss of Instance Health Indication
- The Problem: In the standard pull model, Prometheus generates the up metric (set to 0) if a scrape fails. With the Pushgateway, Prometheus is only scraping the Pushgateway, not your original job. You lose the automatic, reliable health check provided by the pull model.
- Mitigation: You must use the Pushgateway’s internal metrics (like push_time_seconds) and Prometheus functions like absent() in your Alertmanager rules to alert if a specific job’s metrics have not been pushed within an expected time frame.
3. Single Point of Failure and Bottleneck
- The Problem: If the Pushgateway instance goes down, all the short-lived jobs relying on it lose their ability to report metrics. It also becomes a potential bottleneck if a large number of jobs push metrics simultaneously.
- Mitigation: For general network traversal issues with long-lived services, explore alternatives like PushProx. For simple machine-tied cron jobs, the Node Exporter’s textfile collector is often a safer choice. Only use the Pushgateway for the limited use cases it was designed for.
4. Misuse for Long-Lived Jobs (The Anti-Pattern)
- The Problem: Using the Pushgateway to avoid configuring service discovery or to work around simple firewall issues for long-running services (APIs, web servers) is an anti-pattern. This fundamentally undermines Prometheus’s design principles.
- Mitigation: Always prefer the pull model for long-lived services. It provides clearer health checks, simpler service discovery, and avoids the data lifecycle issues inherent to pushing.
Conclusion
The Prometheus Pushgateway is a powerful and necessary tool for monitoring specific types of workloads that don’t fit the standard pull model. For short-lived batch jobs, ephemeral functions, or certain network-isolated services, it’s invaluable.
However, its use requires diligence regarding metric lifecycles and understanding the implications for health monitoring. When used correctly and with awareness of its limitations, the Pushgateway ensures that no critical metric is left behind, even in the most transient corners of your infrastructure.